®
Winter 2019
CRUSHED SCAFFOLD
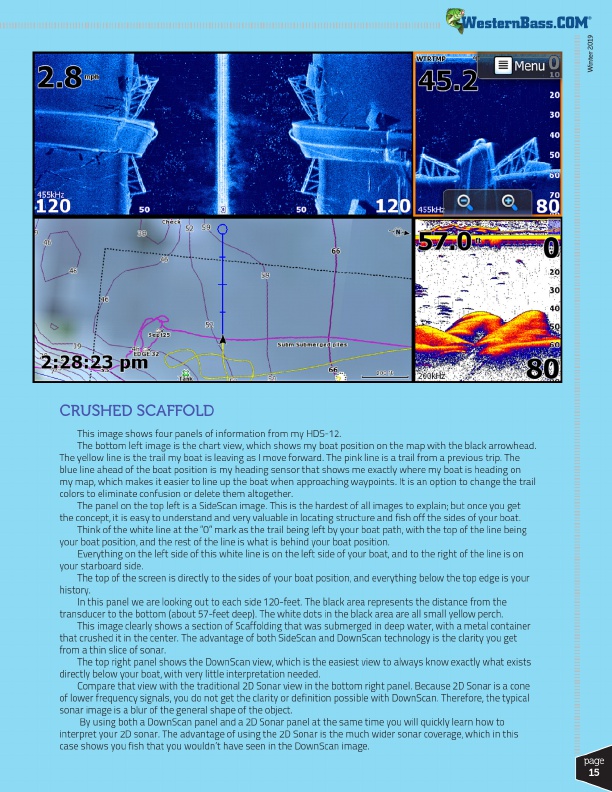
This image shows four panels of information from my HDS-12.
The bottom left image is the chart view, which shows my boat position on the map with the black arrowhead. The yellow line is the trail my boat is leaving as I move forward. The pink line is a trail from a previous trip. The blue line ahead of the boat position is my heading sensor that shows me exactly where my boat is heading on my map, which makes it easier to line up the boat when approaching waypoints. It is an option to change the trail colors to eliminate confusion or delete them altogether.
The panel on the top left is a SideScan image. This is the hardest of all images to explain; but once you get the concept, it is easy to understand and very valuable in locating structure and fish off the sides of your boat.
Think of the white line at the “0” mark as the trail being left by your boat path, with the top of the line being your boat position, and the rest of the line is what is behind your boat position.
Everything on the left side of this white line is on the left side of your boat, and to the right of the line is on your starboard side.
The top of the screen is directly to the sides of your boat position, and everything below the top edge is your history.
In this panel we are looking out to each side 120-feet. The black area represents the distance from the transducer to the bottom (about 57-feet deep). The white dots in the black area are all small yellow perch.
This image clearly shows a section of Scaffolding that was submerged in deep water, with a metal container that crushed it in the center. The advantage of both SideScan and DownScan technology is the clarity you get from a thin slice of sonar.
The top right panel shows the DownScan view, which is the easiest view to always know exactly what exists directly below your boat, with very little interpretation needed.
Compare that view with the traditional 2D Sonar view in the bottom right panel. Because 2D Sonar is a cone of lower frequency signals, you do not get the clarity or definition possible with DownScan. Therefore, the typical sonar image is a blur of the general shape of the object.
By using both a DownScan panel and a 2D Sonar panel at the same time you will quickly learn how to interpret your 2D sonar. The advantage of using the 2D Sonar is the much wider sonar coverage, which in this case shows you fish that you wouldn’t have seen in the DownScan image.
page
15