®
Spring 2021
page 60
Not only is the frequency, but also the magnitude, of annual fluctuation increasing with time.
The greatest annual fluctuations for this 35-year dataset have occurred in the past 5-years.
Average annual fluctuation between 1985 and 2000 was 106-feet. This increased to 142-feet annually between 2000- 2020 and was 157 during that last 10-years. While there are certainly many factors affecting this metric – it is clear that the annual fluctuation is increasing.
considerations in using said metric – however, it is a valuable tool to take a collective pulse.
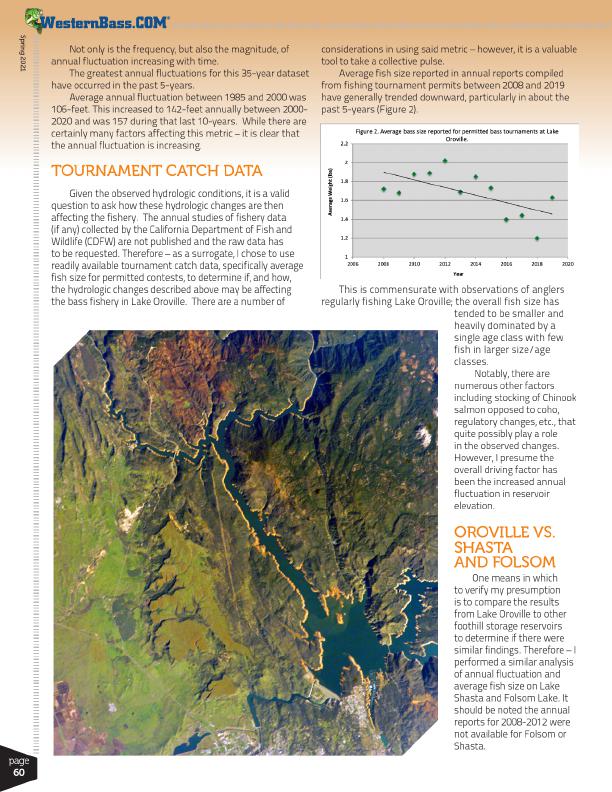
Average fish size reported in annual reports compiled from fishing tournament permits between 2008 and 2019 have generally trended downward, particularly in about the past 5-years (Figure 2).
TOURNAMENT CATCH DATA
Given the observed hydrologic conditions, it is a valid question to ask how these hydrologic changes are then affecting the fishery. The annual studies of fishery data (if any) collected by the California Department of Fish and Wildlife (CDFW) are not published and the raw data has to be requested. Therefore – as a surrogate, I chose to use readily available tournament catch data, specifically average fish size for permitted contests, to determine if, and how, the hydrologic changes described above may be affecting the bass fishery in Lake Oroville. There are a number of
This is commensurate with observations of anglers regularly fishing Lake Oroville; the overall fish size has
tended to be smaller and
heavily dominated by a
single age class with few
fish in larger size/age
classes.
Notably, there are
numerous other factors
including stocking of Chinook
salmon opposed to coho,
regulatory changes, etc., that
quite possibly play a role
in the observed changes.
However, I presume the
overall driving factor has
been the increased annual
fluctuation in reservoir
elevation.
OROVILLE VS. SHASTA AND FOLSOM
One means in which to verify my presumption is to compare the results from Lake Oroville to other foothill storage reservoirs to determine if there were similar findings. Therefore – I performed a similar analysis of annual fluctuation and average fish size on Lake Shasta and Folsom Lake. It should be noted the annual reports for 2008-2012 were not available for Folsom or Shasta.