Spring 2021
A
s I sit down to write this article – we are
just heading into winter and we are already
considerably below normal for annual rainfall. The long-range deterministic models are not encouraging
as to California having a wet winter – in fact, only the most
optimistic models are suggesting an average season.
With ever increasing demands for water resources in
California – in conjunction with drought and a changing climate
– we are seeing some changes in reservoir operations.
In this article – I wanted to explore a bit of what the data are
telling us about operations of our reservoirs, with an emphasis
on Lake Oroville, and perhaps what we are seeing with regard to
changes in the fishery. Hopefully – by the time everyone reads this
– the rains have come and the reservoirs are full!
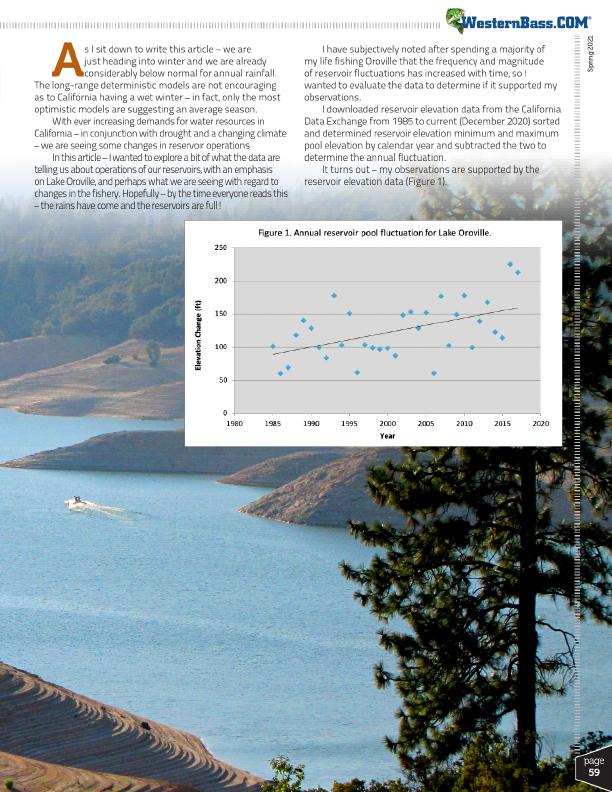
I have subjectively noted after spending a majority of my life fishing Oroville that the frequency and magnitude of reservoir fluctuations has increased with time, so I wanted to evaluate the data to determine if it supported my observations.
I downloaded reservoir elevation data from the California Data Exchange from 1985 to current (December 2020) sorted and determined reservoir elevation minimum and maximum pool elevation by calendar year and subtracted the two to determine the annual fluctuation.
It turns out – my observations are supported by the reservoir elevation data (Figure 1).
®
page 59