Spring 2019
®
I
t is no secret that bass are often located at
the edges of structure, and they love rockpiles,
bushes, weeds, wood, or anything that attracts their prey. The most successful anglers know
to fish visible cover like fallen trees on the shoreline,
or matted weeds. Fewer have mastered the art of
finding this same type of habitat deep below the
surface where it cannot be found with the naked eye.
Imagine, if with the naked eye, we could see deep
rocks, creek channels, sunken boats, and all the other
places where bass are found. Modern electronics can
do this, and they can save the precise location on a chart, so we can always return.
While a fishfinder functions as your underwater eyes, the image it displays often confuses your brain.
The image requires interpretation, and with experience the interpretation becomes easier, and more correct. The purpose of this series of articles is to show various screen shots and interpret what they reveal. Hopefully the explanations will improve your ability to interpret your electronics, and you will catch more fish.
PILINGS
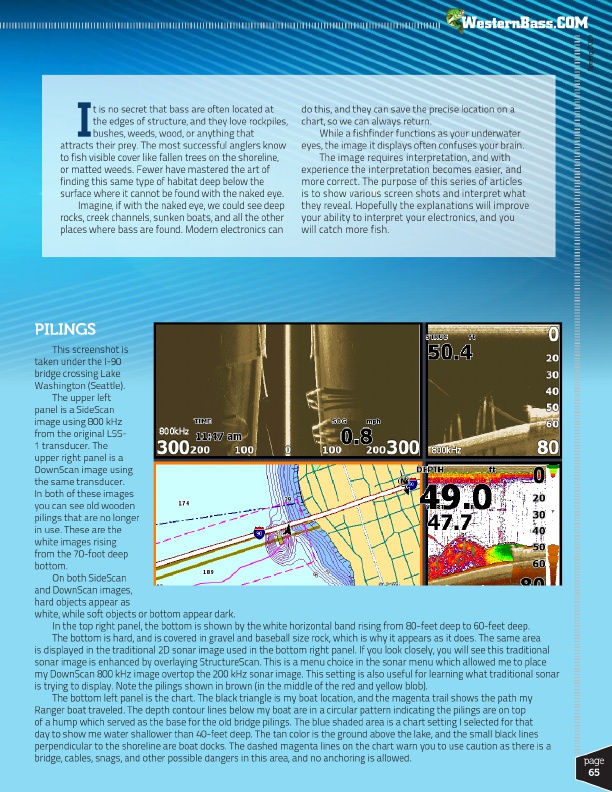
This screenshot is taken under the I-90 bridge crossing Lake Washington (Seattle).
The upper left panel is a SideScan image using 800 kHz from the original LSS- 1 transducer. The upper right panel is a DownScan image using the same transducer. In both of these images you can see old wooden pilings that are no longer in use. These are the white images rising from the 70-foot deep bottom.
On both SideScan and DownScan images, hard objects appear as white, while soft objects or bottom appear dark.
In the top right panel, the bottom is shown by the white horizontal band rising from 80-feet deep to 60-feet deep.
The bottom is hard, and is covered in gravel and baseball size rock, which is why it appears as it does. The same area is displayed in the traditional 2D sonar image used in the bottom right panel. If you look closely, you will see this traditional sonar image is enhanced by overlaying StructureScan. This is a menu choice in the sonar menu which allowed me to place my DownScan 800 kHz image overtop the 200 kHz sonar image. This setting is also useful for learning what traditional sonar is trying to display. Note the pilings shown in brown (in the middle of the red and yellow blob).
The bottom left panel is the chart. The black triangle is my boat location, and the magenta trail shows the path my Ranger boat traveled. The depth contour lines below my boat are in a circular pattern indicating the pilings are on top of a hump which served as the base for the old bridge pilings. The blue shaded area is a chart setting I selected for that day to show me water shallower than 40-feet deep. The tan color is the ground above the lake, and the small black lines perpendicular to the shoreline are boat docks. The dashed magenta lines on the chart warn you to use caution as there is a bridge, cables, snags, and other possible dangers in this area, and no anchoring is allowed.
page 65