Winter 2024
®
I
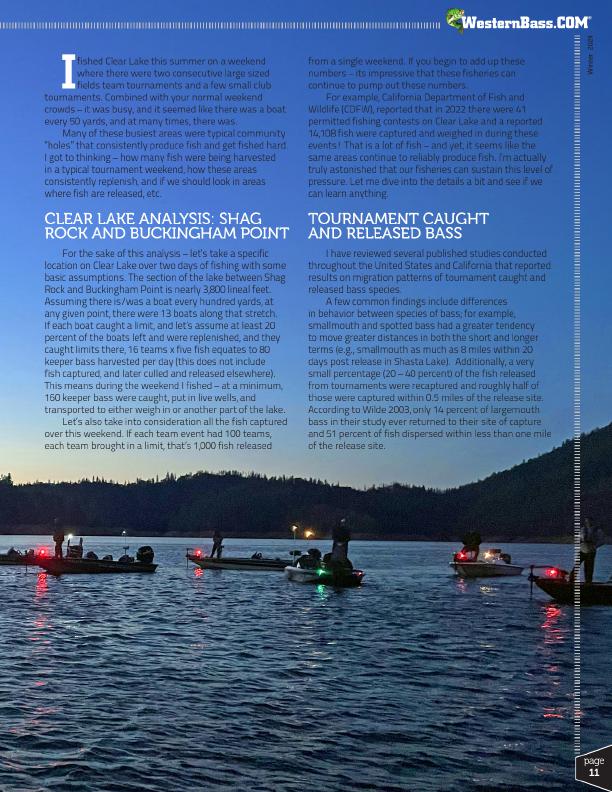
fished Clear Lake this summer on a weekend
where there were two consecutive large sized
fields team tournaments and a few small club tournaments. Combined with your normal weekend
crowds – it was busy, and it seemed like there was a boat
every 50 yards, and at many times, there was.
Many of these busiest areas were typical community
“holes” that consistently produce fish and get fished hard.
I got to thinking – how many fish were being harvested
in a typical tournament weekend, how these areas
consistently replenish, and if we should look in areas
where fish are released, etc.
CLEAR LAKE ANALYSIS: SHAG ROCK AND BUCKINGHAM POINT
For the sake of this analysis – let’s take a specific location on Clear Lake over two days of fishing with some basic assumptions. The section of the lake between Shag Rock and Buckingham Point is nearly 3,800 lineal feet. Assuming there is/was a boat every hundred yards, at any given point, there were 13 boats along that stretch. If each boat caught a limit, and let’s assume at least 20 percent of the boats left and were replenished, and they caught limits there, 16 teams x five fish equates to 80 keeper bass harvested per day (this does not include fish captured, and later culled and released elsewhere). This means during the weekend I fished – at a minimum, 160 keeper bass were caught, put in live wells, and transported to either weigh in or another part of the lake.
Let’s also take into consideration all the fish captured over this weekend. If each team event had 100 teams, each team brought in a limit, that’s 1,000 fish released
from a single weekend. If you begin to add up these numbers – its impressive that these fisheries can continue to pump out these numbers.
For example, California Department of Fish and Wildlife (CDFW), reported that in 2022 there were 41 permitted fishing contests on Clear Lake and a reported 14,108 fish were captured and weighed in during these events! That is a lot of fish – and yet, it seems like the same areas continue to reliably produce fish. I’m actually truly astonished that our fisheries can sustain this level of pressure. Let me dive into the details a bit and see if we can learn anything.
TOURNAMENT CAUGHT AND RELEASED BASS
I have reviewed several published studies conducted throughout the United States and California that reported results on migration patterns of tournament caught and released bass species.
A few common findings include differences in behavior between species of bass; for example, smallmouth and spotted bass had a greater tendency to move greater distances in both the short and longer terms (e.g., smallmouth as much as 8 miles within 20 days post release in Shasta Lake). Additionally, a very small percentage (20 – 40 percent) of the fish released from tournaments were recaptured and roughly half of those were captured within 0.5 miles of the release site. According to Wilde 2003, only 14 percent of largemouth bass in their study ever returned to their site of capture and 51 percent of fish dispersed within less than one mile of the release site.
page
11