®
Fall 2019
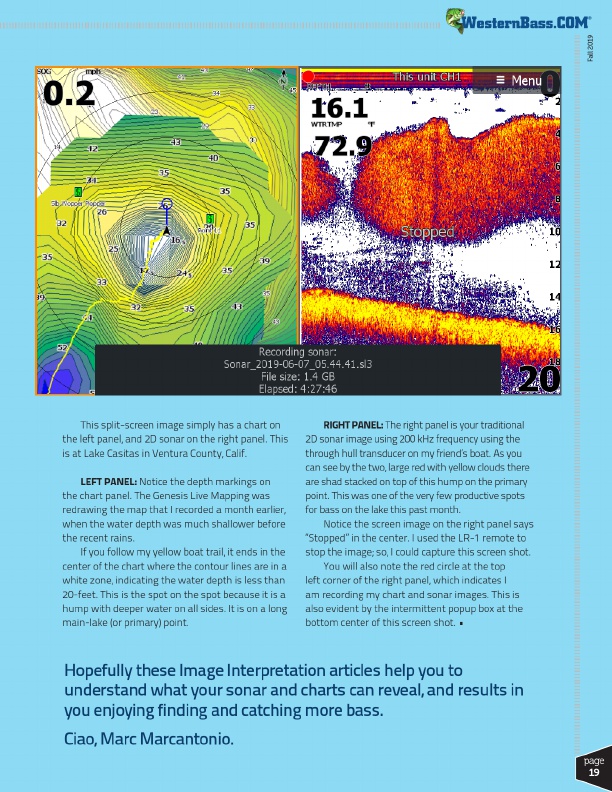
This split-screen image simply has a chart on the left panel, and 2D sonar on the right panel. This is at Lake Casitas in Ventura County, Calif.
LEFT PANEL: Notice the depth markings on the chart panel. The Genesis Live Mapping was redrawing the map that I recorded a month earlier, when the water depth was much shallower before the recent rains.
If you follow my yellow boat trail, it ends in the center of the chart where the contour lines are in a white zone, indicating the water depth is less than 20-feet. This is the spot on the spot because it is a hump with deeper water on all sides. It is on a long main-lake (or primary) point.
RIGHT PANEL: The right panel is your traditional 2D sonar image using 200 kHz frequency using the through hull transducer on my friend’s boat. As you can see by the two, large red with yellow clouds there are shad stacked on top of this hump on the primary point. This was one of the very few productive spots for bass on the lake this past month.
Notice the screen image on the right panel says “Stopped” in the center. I used the LR-1 remote to stop the image; so, I could capture this screen shot.
You will also note the red circle at the top left corner of the right panel, which indicates I am recording my chart and sonar images. This is also evident by the intermittent popup box at the bottom center of this screen shot. •
Hopefully these Image Interpretation articles help you to understand what your sonar and charts can reveal, and results in you enjoying finding and catching more bass.
Ciao, Marc Marcantonio.
page
19