®
Fall 2019
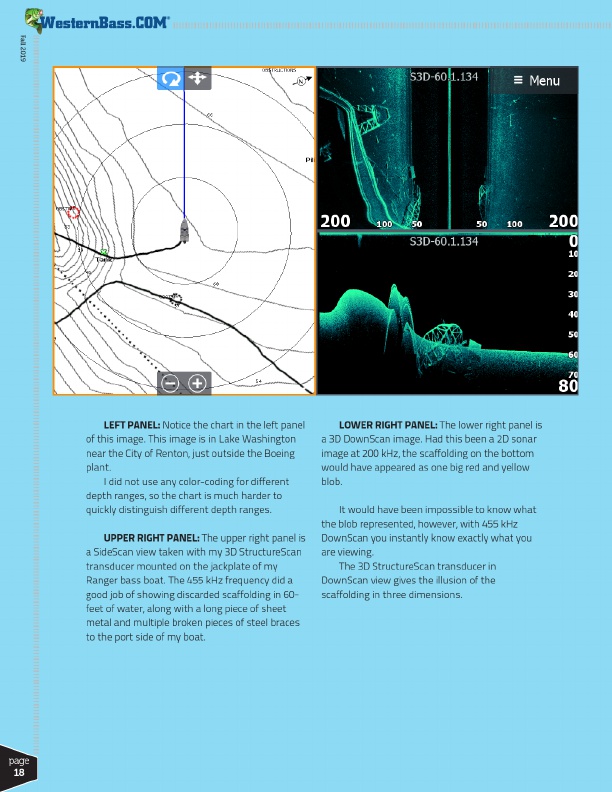
LEFT PANEL: Notice the chart in the left panel of this image. This image is in Lake Washington near the City of Renton, just outside the Boeing plant.
I did not use any color-coding for different depth ranges, so the chart is much harder to quickly distinguish different depth ranges.
UPPER RIGHT PANEL: The upper right panel is a SideScan view taken with my 3D StructureScan transducer mounted on the jackplate of my Ranger bass boat. The 455 kHz frequency did a good job of showing discarded scaffolding in 60- feet of water, along with a long piece of sheet metal and multiple broken pieces of steel braces to the port side of my boat.
LOWER RIGHT PANEL: The lower right panel is a 3D DownScan image. Had this been a 2D sonar image at 200 kHz, the scaffolding on the bottom would have appeared as one big red and yellow blob.
It would have been impossible to know what the blob represented, however, with 455 kHz DownScan you instantly know exactly what you are viewing.
The 3D StructureScan transducer in DownScan view gives the illusion of the scaffolding in three dimensions.
page
18