®
Fall 2019
page
16
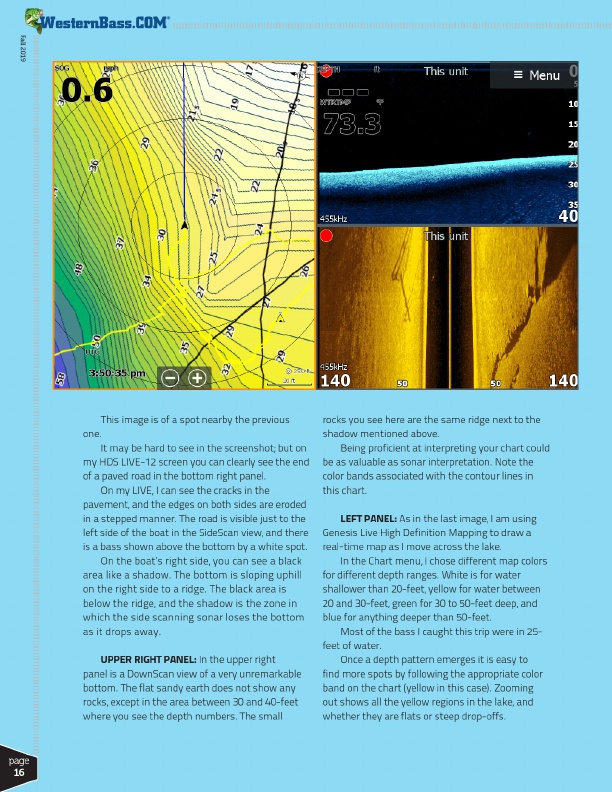
This image is of a spot nearby the previous one.
It may be hard to see in the screenshot; but on my HDS LIVE-12 screen you can clearly see the end of a paved road in the bottom right panel.
On my LIVE, I can see the cracks in the pavement, and the edges on both sides are eroded in a stepped manner. The road is visible just to the left side of the boat in the SideScan view, and there is a bass shown above the bottom by a white spot.
On the boat’s right side, you can see a black area like a shadow. The bottom is sloping uphill on the right side to a ridge. The black area is below the ridge, and the shadow is the zone in which the side scanning sonar loses the bottom as it drops away.
UPPER RIGHT PANEL: In the upper right panel is a DownScan view of a very unremarkable bottom. The flat sandy earth does not show any rocks, except in the area between 30 and 40-feet where you see the depth numbers. The small
rocks you see here are the same ridge next to the shadow mentioned above.
Being proficient at interpreting your chart could be as valuable as sonar interpretation. Note the color bands associated with the contour lines in this chart.
LEFT PANEL: As in the last image, I am using Genesis Live High Definition Mapping to draw a real-time map as I move across the lake.
In the Chart menu, I chose different map colors for different depth ranges. White is for water shallower than 20-feet, yellow for water between 20 and 30-feet, green for 30 to 50-feet deep, and blue for anything deeper than 50-feet.
Most of the bass I caught this trip were in 25- feet of water.
Once a depth pattern emerges it is easy to find more spots by following the appropriate color band on the chart (yellow in this case). Zooming out shows all the yellow regions in the lake, and whether they are flats or steep drop-offs.